
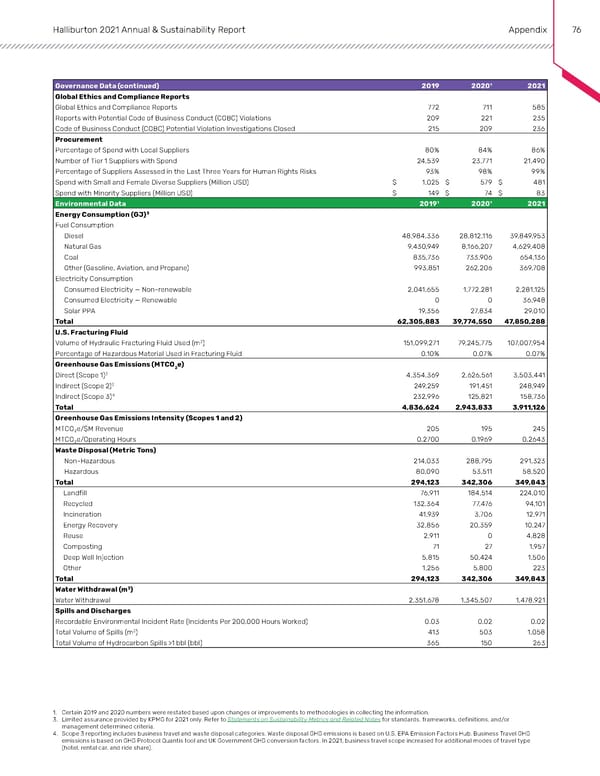
Halliburton 2021 Annual & Sustainability Report Appendix 76 Governance Data (continued) 2019 2020¹ 2021 Global Ethics and Compliance Reports Global Ethics and Compliance Reports 772 711 585 Reports with Potential Code of Business Conduct (COBC) Violations 209 221 235 Code of Business Conduct (COBC) Potential Violation Investigations Closed 215 209 236 Procurement Percentage of Spend with Local Suppliers 80% 84% 86% Number of Tier 1 Suppliers with Spend 24,539 23,771 21,490 Percentage of Suppliers Assessed in the Last Three Years for Human Rights Risks 93% 98% 99% Spend with Small and Female Diverse Suppliers (Million USD) $ 1,025 $ 579 $ 481 Spend with Minority Suppliers (Million USD) $ 149 $ 74 $ 83 Environmental Data 2019¹ 2020¹ 2021 Energy Consumption (GJ)3 Fuel Consumption Diesel 48,984,336 28,812,116 39,849,953 Natural Gas 9,430,949 8,166,207 4,629,408 Coal 835,736 733,906 654,136 Other (Gasoline, Aviation, and Propane) 993,851 262,206 369,708 Electricity Consumption Consumed Electricity — Non-renewable 2,041,655 1,772,281 2,281,125 Consumed Electricity — Renewable 0 0 36,948 Solar PPA 19,356 27,834 29,010 Total 62,305,883 39,774,550 47,850,288 U.S. Fracturing Fluid Volume of Hydraulic Fracturing Fluid Used (m3) 151,099,271 79,245,775 107,007,954 Percentage of Hazardous Material Used in Fracturing Fluid 0.10% 0.07% 0.07% Greenhouse Gas Emissions (MTCO2e) Direct (Scope 1)3 4,354,369 2,626,561 3,503,441 Indirect (Scope 2)3 249,259 191,451 248,949 Indirect (Scope 3)4 232,996 125,821 158,736 Total 4,836,624 2,943,833 3,911,126 Greenhouse Gas Emissions Intensity (Scopes 1 and 2) MTCO2e/$M Revenue 205 195 245 MTCO2e/Operating Hours 0.2700 0.1969 0.2643 Waste Disposal (Metric Tons) Non-Hazardous 214,033 288,795 291,323 Hazardous 80,090 53,511 58,520 Total 294,123 342,306 349,843 Landfill 76,911 184,514 224,010 Recycled 132,364 77,476 94,101 Incineration 41,939 3,706 12,971 Energy Recovery 32,856 20,359 10,247 Reuse 2,911 0 4,828 Composting 71 27 1,957 Deep Well Injection 5,815 50,424 1,506 Other 1,256 5,800 223 Total 294,123 342,306 349,843 Water Withdrawal (m3) Water Withdrawal 2,351,678 1,345,507 1,478,921 Spills and Discharges Recordable Environmental Incident Rate (Incidents Per 200,000 Hours Worked) 0.03 0.02 0.02 Total Volume of Spills (m3) 413 503 1,058 Total Volume of Hydrocarbon Spills >1 bbl (bbl) 365 150 263 1. Certain 2019 and 2020 numbers were restated based upon changes or improvements to methodologies in collecting the information. 3. Limited assurance provided by KPMG for 2021 only. Refer to Statements on Sustainability Metrics and Related Notes for standards, frameworks, definitions, and/or management determined criteria. 4. S cope 3 reporting includes business travel and waste disposal categories. Waste disposal GHG emissions is based on U.S. EPA Emission Factors Hub. Business Travel GHG emissions is based on GHG Protocol Quantis tool and UK Government GHG conversion factors. In 2021, business travel scope increased for additional modes of travel type (hotel, rental car, and ride share).
 Annual & Sustainability Report | Halliburton Page 74 Page 76