
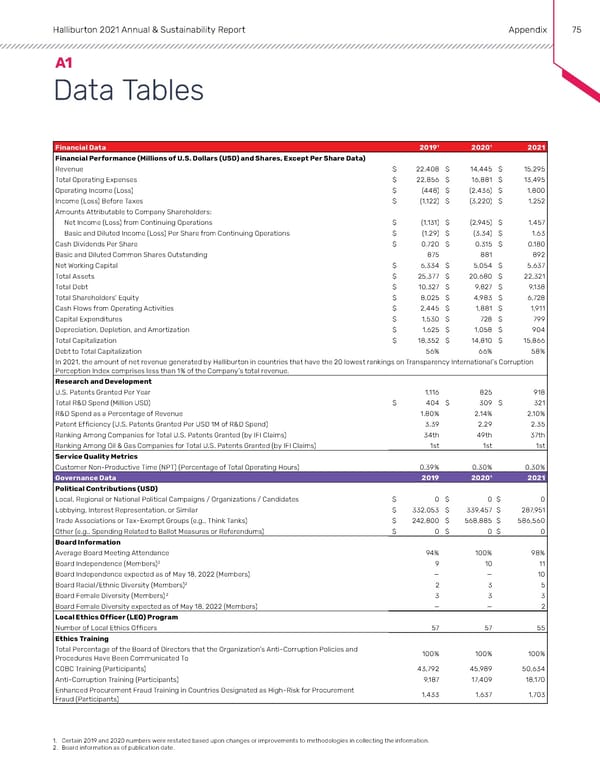
Halliburton 2021 Annual & Sustainability Report Appendix 75 A1 Data Tables Financial Data 2019¹ 2020¹ 2021 Financial Performance (Millions of U.S. Dollars (USD) and Shares, Except Per Share Data) Revenue $ 22,408 $ 14,445 $ 15,295 Total Operating Expenses $ 22,856 $ 16,881 $ 13,495 Operating Income (Loss) $ (448) $ (2,436) $ 1,800 Income (Loss) Before Taxes $ (1,122) $ (3,220) $ 1,252 Amounts Attributable to Company Shareholders: Net Income (Loss) from Continuing Operations $ (1,131) $ (2,945) $ 1,457 Basic and Diluted Income (Loss) Per Share from Continuing Operations $ (1.29) $ (3.34) $ 1.63 Cash Dividends Per Share $ 0.720 $ 0.315 $ 0.180 Basic and Diluted Common Shares Outstanding 875 881 892 Net Working Capital $ 6,334 $ 5,054 $ 5,637 Total Assets $ 25,377 $ 20,680 $ 22,321 Total Debt $ 10,327 $ 9,827 $ 9,138 Total Shareholders' Equity $ 8,025 $ 4,983 $ 6,728 Cash Flows from Operating Activities $ 2,445 $ 1,881 $ 1,911 Capital Expenditures $ 1,530 $ 728 $ 799 Depreciation, Depletion, and Amortization $ 1,625 $ 1,058 $ 904 Total Capitalization $ 18,352 $ 14,810 $ 15,866 Debt to Total Capitalization 56% 66% 58% In 2021, the amount of net revenue generated by Halliburton in countries that have the 20 lowest rankings on Transparency International’s Corruption Perception Index comprises less than 1% of the Company’s total revenue. Research and Development U.S. Patents Granted Per Year 1,116 825 918 Total R&D Spend (Million USD) $ 404 $ 309 $ 321 R&D Spend as a Percentage of Revenue 1.80% 2.14% 2.10% Patent Efficiency (U.S. Patents Granted Per USD 1M of R&D Spend) 3.39 2.29 2.35 Ranking Among Companies for Total U.S. Patents Granted (by IFI Claims) 34th 49th 37th Ranking Among Oil & Gas Companies for Total U.S. Patents Granted (by IFI Claims) 1st 1st 1st Service Quality Metrics Customer Non-Productive Time (NPT) (Percentage of Total Operating Hours) 0.39% 0.30% 0.30% Governance Data 2019 2020¹ 2021 Political Contributions (USD) Local, Regional or National Political Campaigns / Organizations / Candidates $ 0 $ 0 $ 0 Lobbying, Interest Representation, or Similar $ 332,053 $ 339,457 $ 287,951 Trade Associations or Tax-Exempt Groups (e.g., Think Tanks) $ 242,800 $ 568,885 $ 586,560 Other (e.g., Spending Related to Ballot Measures or Referendums) $ 0 $ 0 $ 0 Board Information Average Board Meeting Attendance 94% 100% 98% Board Independence (Members)2 9 10 11 Board Independence expected as of May 18, 2022 (Members) — — 10 Board Racial/Ethnic Diversity (Members)2 2 3 5 2 Board Female Diversity (Members) 3 3 3 Board Female Diversity expected as of May 18, 2022 (Members) — — 2 Local Ethics Officer (LEO) Program Number of Local Ethics Officers 57 57 55 Ethics Training Total Percentage of the Board of Directors that the Organization’s Anti-Corruption Policies and 100% 100% 100% Procedures Have Been Communicated To COBC Training (Participants) 43,792 45,989 50,634 Anti-Corruption Training (Participants) 9,187 17,409 18,170 Enhanced Procurement Fraud Training in Countries Designated as High-Risk for Procurement 1,433 1,637 1,703 Fraud (Participants) 1. Certain 2019 and 2020 numbers were restated based upon changes or improvements to methodologies in collecting the information. 2. Board information as of publication date.
 Annual & Sustainability Report | Halliburton Page 73 Page 75