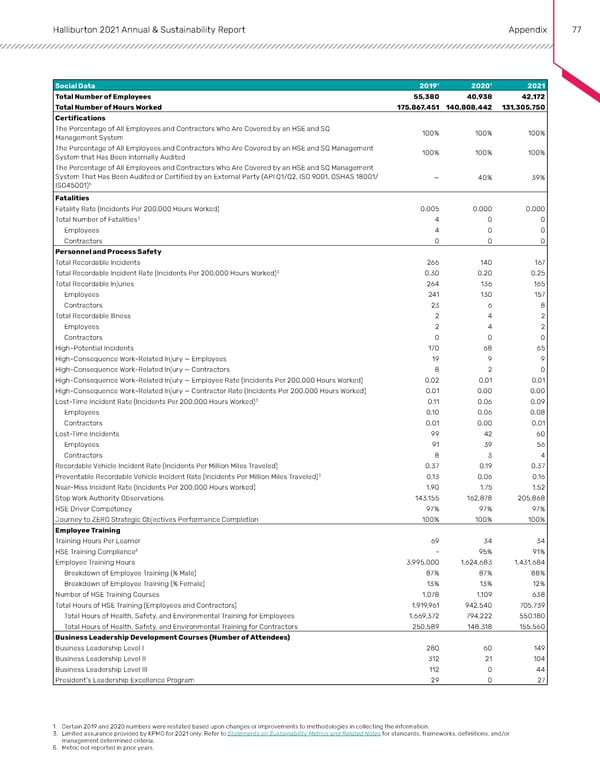
Halliburton 2021 Annual & Sustainability Report Appendix 77 Social Data 2019¹ 2020¹ 2021 Total Number of Employees 55,380 40,938 42,172 Total Number of Hours Worked 175,867,451 140,808,442 131,305,750 Certifications The Percentage of All Employees and Contractors Who Are Covered by an HSE and SQ 100% 100% 100% Management System The Percentage of All Employees and Contractors Who Are Covered by an HSE and SQ Management 100% 100% 100% System that Has Been Internally Audited The Percentage of All Employees and Contractors Who Are Covered by an HSE and SQ Management System That Has Been Audited or Certified by an External Party (API Q1/Q2, ISO 9001, OSHAS 18001/ — 40% 39% ISO45001)5 Fatalities Fatality Rate (Incidents Per 200,000 Hours Worked) 0.005 0.000 0.000 Total Number of Fatalities3 4 0 0 Employees 4 0 0 Contractors 0 0 0 Personnel and Process Safety Total Recordable Incidents 266 140 167 Total Recordable Incident Rate (Incidents Per 200,000 Hours Worked)3 0.30 0.20 0.25 Total Recordable Injuries 264 136 165 Employees 241 130 157 Contractors 23 6 8 Total Recordable Illness 2 4 2 Employees 2 4 2 Contractors 0 0 0 High-Potential Incidents 170 68 65 High-Consequence Work-Related Injury — Employees 19 9 9 High-Consequence Work-Related Injury — Contractors 8 2 0 High-Consequence Work-Related Injury — Employee Rate (Incidents Per 200,000 Hours Worked) 0.02 0.01 0.01 High-Consequence Work-Related Injury — Contractor Rate (Incidents Per 200,000 Hours Worked) 0.01 0.00 0.00 Lost-Time Incident Rate (Incidents Per 200,000 Hours Worked)3 0.11 0.06 0.09 Employees 0.10 0.06 0.08 Contractors 0.01 0.00 0.01 Lost-Time Incidents 99 42 60 Employees 91 39 56 Contractors 8 3 4 Recordable Vehicle Incident Rate (Incidents Per Million Miles Traveled) 0.37 0.19 0.37 Preventable Recordable Vehicle Incident Rate (Incidents Per Million Miles Traveled)3 0.13 0.06 0.16 Near-Miss Incident Rate (Incidents Per 200,000 Hours Worked) 1.90 1.75 1.52 Stop Work Authority Observations 143,155 162,878 205,868 HSE Driver Competency 97% 97% 97% Journey to ZERO Strategic Objectives Performance Completion 100% 100% 100% Employee Training Training Hours Per Learner 69 34 34 HSE Training Compliance5 - 95% 91% Employee Training Hours 3,995,000 1,624,683 1,431,684 Breakdown of Employee Training (% Male) 87% 87% 88% Breakdown of Employee Training (% Female) 13% 13% 12% Number of HSE Training Courses 1,078 1,109 638 Total Hours of HSE Training (Employees and Contractors) 1,919,961 942,540 705,739 Total Hours of Health, Safety, and Environmental Training for Employees 1,669,372 794,222 550,180 Total Hours of Health, Safety, and Environmental Training for Contractors 250,589 148,318 155,560 Business Leadership Development Courses (Number of Attendees) Business Leadership Level I 280 60 149 Business Leadership Level II 312 21 104 Business Leadership Level III 112 0 44 President’s Leadership Excellence Program 29 0 27 1. Certain 2019 and 2020 numbers were restated based upon changes or improvements to methodologies in collecting the information. 3. Limited assurance provided by KPMG for 2021 only. Refer to Statements on Sustainability Metrics and Related Notes for standards, frameworks, definitions, and/or management determined criteria. 5. Metric not reported in prior years.
 Annual & Sustainability Report | Halliburton Page 75 Page 77