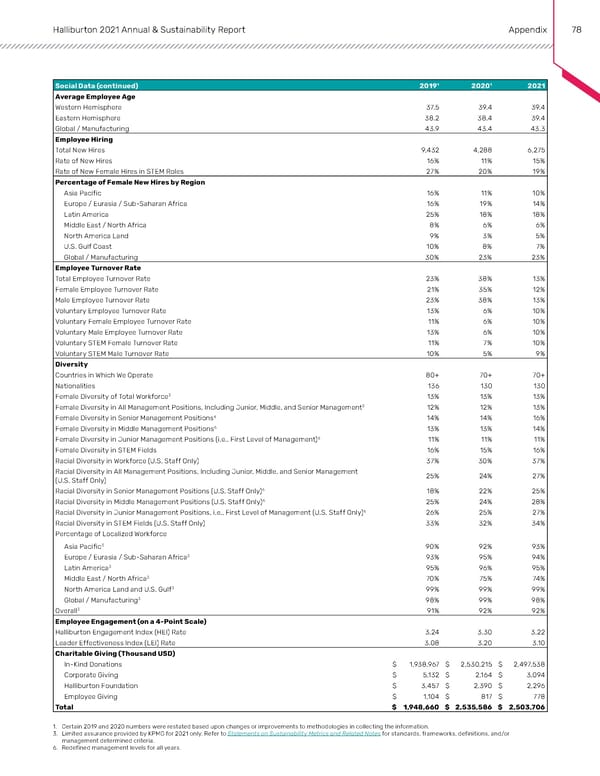
Halliburton 2021 Annual & Sustainability Report Appendix 78 Social Data (continued) 2019¹ 2020¹ 2021 Average Employee Age Western Hemisphere 37.5 39.4 39.4 Eastern Hemisphere 38.2 38.4 39.4 Global / Manufacturing 43.9 43.4 43.3 Employee Hiring Total New Hires 9,432 4,288 6,275 Rate of New Hires 16% 11% 15% Rate of New Female Hires in STEM Roles 27% 20% 19% Percentage of Female New Hires by Region Asia Pacific 16% 11% 10% Europe / Eurasia / Sub-Saharan Africa 16% 19% 14% Latin America 25% 18% 18% Middle East / North Africa 8% 6% 6% North America Land 9% 3% 5% U.S. Gulf Coast 10% 8% 7% Global / Manufacturing 30% 23% 23% Employee Turnover Rate Total Employee Turnover Rate 23% 38% 13% Female Employee Turnover Rate 21% 35% 12% Male Employee Turnover Rate 23% 38% 13% Voluntary Employee Turnover Rate 13% 6% 10% Voluntary Female Employee Turnover Rate 11% 6% 10% Voluntary Male Employee Turnover Rate 13% 6% 10% Voluntary STEM Female Turnover Rate 11% 7% 10% Voluntary STEM Male Turnover Rate 10% 5% 9% Diversity Countries in Which We Operate 80+ 70+ 70+ Nationalities 136 130 130 Female Diversity of Total Workforce3 13% 13% 13% Female Diversity in All Management Positions, Including Junior, Middle, and Senior Management3 12% 12% 13% Female Diversity in Senior Management Positions6 14% 14% 16% Female Diversity in Middle Management Positions6 13% 13% 14% Female Diversity in Junior Management Positions (i.e., First Level of Management)6 11% 11% 11% Female Diversity in STEM Fields 16% 15% 16% Racial Diversity in Workforce (U.S. Staff Only) 37% 30% 37% Racial Diversity in All Management Positions, Including Junior, Middle, and Senior Management 25% 24% 27% (U.S. Staff Only) Racial Diversity in Senior Management Positions (U.S. Staff Only)6 18% 22% 25% Racial Diversity in Middle Management Positions (U.S. Staff Only)6 25% 24% 28% 6 Racial Diversity in Junior Management Positions, i.e., First Level of Management (U.S. Staff Only) 26% 25% 27% Racial Diversity in STEM Fields (U.S. Staff Only) 33% 32% 34% Percentage of Localized Workforce Asia Pacific3 90% 92% 93% Europe / Eurasia / Sub-Saharan Africa3 93% 95% 94% 3 Latin America 95% 96% 95% Middle East / North Africa3 70% 75% 74% North America Land and U.S. Gulf3 99% 99% 99% Global / Manufacturing3 98% 99% 98% Overall3 91% 92% 92% Employee Engagement (on a 4-Point Scale) Halliburton Engagement Index (HEI) Rate 3.24 3.30 3.22 Leader Effectiveness Index (LEI) Rate 3.08 3.20 3.10 Charitable Giving (Thousand USD) In-Kind Donations $ 1,938,967 $ 2,530,215 $ 2,497,538 Corporate Giving $ 5,132 $ 2,164 $ 3,094 Halliburton Foundation $ 3,457 $ 2,390 $ 2,296 Employee Giving $ 1,104 $ 817 $ 778 Total $ 1,948,660 $ 2,535,586 $ 2,503,706 1. Certain 2019 and 2020 numbers were restated based upon changes or improvements to methodologies in collecting the information. 3. Limited assurance provided by KPMG for 2021 only. Refer to Statements on Sustainability Metrics and Related Notes for standards, frameworks, definitions, and/or management determined criteria. 6. Redefined management levels for all years.
 Annual & Sustainability Report | Halliburton Page 76 Page 78