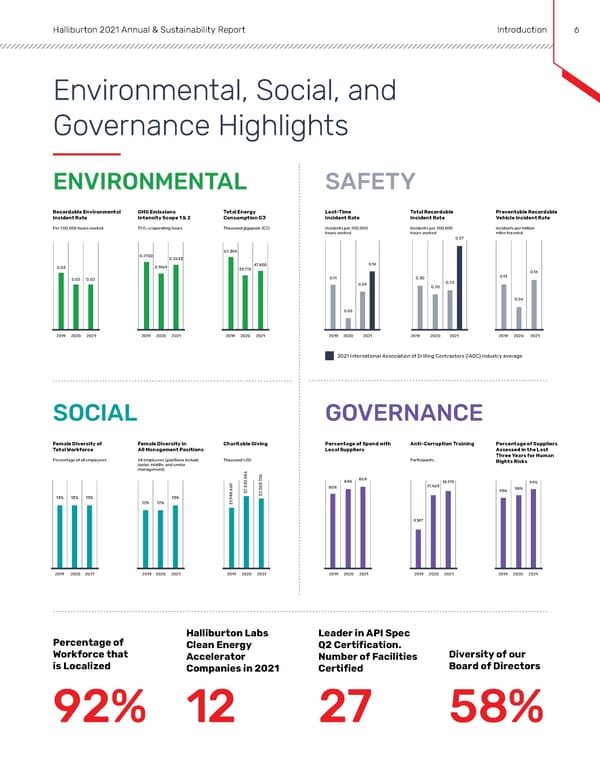
Halliburton 2021 Annual & Sustainability Report Introduction 6 Environmental, Social, and Governance Highlights ENVIRONMENTAL SAFETY Recordable Environmental GHG Emissions Total Energy Lost-Time Total Recordable Preventable Recordable Incident Rate Intensity Scope 1 & 2 Consumption GJ Incident Rate Incident Rate Vehicle Incident Rate Per 200,000 hours worked TCO2 e/operating hours Thousand gigajoule (GJ) Incidents per 200,000 Incidents per 200,000 Incidents per million hours worked hours worked miles traveled 0.57 62,306 0.2700 0.2643 0.1969 47,850 0.16 0.03 39,775 0.16 0.02 0.02 0.11 0.30 0.13 0.09 0.25 0.20 0.06 0.06 2019 2020 2021 2019 2020 2021 2019 2020 2021 2019 2020 2021 2019 2020 2021 2019 2020 2021 2021 International Association of Drilling Contractors (IADC) industry average SOCIAL GOVERNANCE Female Diversity of Female Diversity in Charitable Giving Percentage of Spend with Anti-Corruption Training Percentage of Suppliers Total Workforce All Management Positions Local Suppliers Assessed in the Last Three Years for Human Percentage of all employees All employees (positions include Thousand USD Participants Rights Risks junior, middle, and senior management) 6 8 6 5 0 , 7 86% 5 , 84% 18,170 99% 0 3 5 03 17,409 66 , 5 80% 98% , 2 , 93% 8 $ 2 13% 13% 13% 13% 4 $ 9 , 12% 12% $1 9,187 2019 2020 2021 2019 2020 2021 2019 2020 2021 2019 2020 2021 2019 2020 2021 2019 2020 2021 Halliburton Labs Leader in API Spec Percentage of Clean Energy Q2 Certification. Workforce that Accelerator Number of Facilities Diversity of our is Localized Companies in 2021 Certified Board of Directors 92% 12 27 58%
 Annual & Sustainability Report | Halliburton Page 4 Page 6