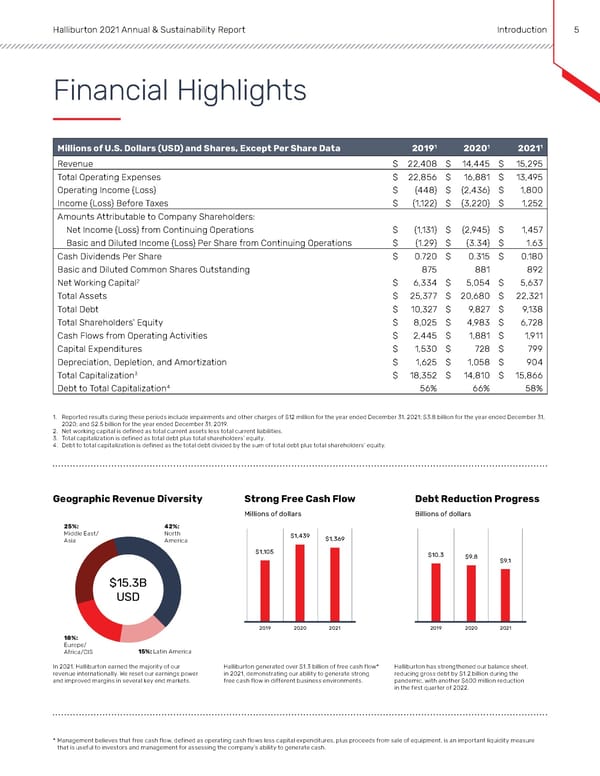
Halliburton 2021 Annual & Sustainability Report Introduction 5 Financial Highlights Millions of U.S. Dollars (USD) and Shares, Except Per Share Data 20191 20201 20211 Revenue $ 22,408 $ 14,445 $ 15,295 Total Operating Expenses $ 22,856 $ 16,881 $ 13,495 Operating Income (Loss) $ (448) $ (2,436) $ 1,800 Income (Loss) Before Taxes $ (1,122) $ (3,220) $ 1,252 Amounts Attributable to Company Shareholders: Net Income (Loss) from Continuing Operations $ (1,131) $ (2,945) $ 1,457 Basic and Diluted Income (Loss) Per Share from Continuing Operations $ (1.29) $ (3.34) $ 1.63 Cash Dividends Per Share $ 0.720 $ 0.315 $ 0.180 Basic and Diluted Common Shares Outstanding 875 881 892 Net Working Capital2 $ 6,334 $ 5,054 $ 5,637 Total Assets $ 25,377 $ 20,680 $ 22,321 Total Debt $ 10,327 $ 9,827 $ 9,138 Total Shareholders' Equity $ 8,025 $ 4,983 $ 6,728 Cash Flows from Operating Activities $ 2,445 $ 1,881 $ 1,911 Capital Expenditures $ 1,530 $ 728 $ 799 Depreciation, Depletion, and Amortization $ 1,625 $ 1,058 $ 904 Total Capitalization3 $ 18,352 $ 14,810 $ 15,866 Debt to Total Capitalization4 56% 66% 58% 1. Reported results during these periods include impairments and other charges of $12 million for the year ended December 31, 2021; $3.8 billion for the year ended December 31, 2020; and $2.5 billion for the year ended December 31, 2019. 2. Net working capital is defined as total current assets less total current liabilities. 3. Total capitalization is defined as total debt plus total shareholders’ equity. 4. Debt to total capitalization is defined as the total debt divided by the sum of total debt plus total shareholders’ equity. Geographic Revenue Diversity Strong Free Cash Flow Debt Reduction Progress Millions of dollars Billions of dollars 25%: 42%: Middle East/ North $1,439 Asia America $1,369 $1,105 $10.3 $9.8 $9.1 $15.3B USD 2019 2020 2021 2019 2020 2021 18%: Europe/ Africa/CIS 15%: Latin America In 2021, Halliburton earned the majority of our Halliburton generated over $1.3 billion of free cash flow* Halliburton has strengthened our balance sheet, revenue internationally. We reset our earnings power in 2021, demonstrating our ability to generate strong reducing gross debt by $1.2 billion during the and improved margins in several key end markets. free cash flow in different business environments. pandemic, with another $600 million reduction in the first quarter of 2022. * Management believes that free cash flow, defined as operating cash flows less capital expenditures, plus proceeds from sale of equipment, is an important liquidity measure that is useful to investors and management for assessing the company’s ability to generate cash.
 Annual & Sustainability Report | Halliburton Page 3 Page 5